home page
 
our mission
our work
our needs
future plans
our sponsors
donations
newsletters
contact us
 
news from nepal
about nepal
some statistics
women children
useful links


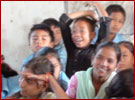
giving hope to students

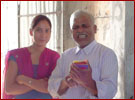
giving help to teachers

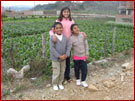
giving shelter to a few

Some statistics about the economics of Nepal

Economics Indicators  
GNI per capita (US$), 2006 290
GDP per capita average annual growth rate (%), 1970-1990 1.1
GDP per capita average annual growth rate (%), 1990-2006 1.9
Average annual rate of inflation (%), 1990-2006 6
% of population below US$1 a day, 1995-2005* 24
% of central government expenditure (1995-2005*) allocated to:, health 5
% of central government expenditure (1995-2005*) allocated to:, education 18
% of central government expenditure (1995-2005*) allocated to:, defence 11
ODA inflow in millions US$, 2005 428
ODA inflow as a % of recipient GNI, 2005 6
Debt service as a % of exports of goods and services, 1990 12
Debt service as a % of exports of goods and services, 2005 5

Definitions of the indicators

GNI per capita - Gross national income (GNI) is the sum of value added by all resident producers plus any product taxes (less subsidies) not included in the valuation of output plus net receipts of primary income (compensation of employees and property income) from abroad. GNI per capita is gross national income divided by mid-year population. GNI per capita in US dollars is converted using the World Bank Atlas method.

GDP per capita - Gross domestic product (GDP) is the sum of value added by all resident producers plus any product taxes (less subsidies) not included in the valuation of output. GDP per capita is gross domestic product divided by mid-year population. Growth is calculated from constant price GDP data in local currency.

% of population below $1 a day - Percentage of population living on less than $1.08 a day at 1993 international prices(equivalent to $1 a day in 1985 prices, adjusted for purchasing power parity).

ODA - Official development assistance.

Debt service - The sum of interest payments and repayments of principal on external public and publicly guaranteed long-term debts.


Main data sources

GNI per capita - World Bank.

GDP per capita - World Bank.

Rate of inflation - World Bank.

% of population below $1 a day - World Bank.

Expenditure on health, education and defence - International Monetary Fund (IMF).

ODA - Organisation for Economic Co-operation and Development (OECD).

Debt service - World Bank.


Notes

a Range $735 or less.

b Range $736 to $2935.

c Range $2936 to $9075.

d Range $9076 or more.

- Data not available.

x Indicates data that refer to years or periods other than those specified in the column heading, differ from the standard definition, or refer to only part of a country.

* Data refer to the most recent year available during the period specified in the column heading.


We have used figures provided by UNICEF from their website

http://www.unicef.org/infobycountry/nepal_nepal_statistics.html